 An airplane accelerating down the runway reaches a critical speed where enough air is forced over the wing to create lift. The airplane rotates and takes off. As long as the speed of the plane stays above that point and power is applied it will accelerate. As it slows it behaves differently. On the graph below is a point called Minimum Power Airspeed. From there on, as the aircraft decelerates more power must be added to maintain altitude. The wing approaches stall, ceases to fly and the only alternative is to push the nose towards the ground. Too close to the ground and the outcome is inevitable. In aviation this is called the back side of the power curve.
 There is an economic relationship very similar to the power curve. This is the relationship of debt to GDP and, more precisely, the relationship of debt service to GDP growth.
Greece is on the back side of the power curve. What happened?
On the surface Greece is not much worse off than the United States. The public debt of Greece is 108% of GDP. In the US it is 90% including intergovernmental holdings of $4.5 trillion made up primarily of borrowings from the Medicare and Social Security trust funds but owed none the less. With an estimated deficit of $1.5 trillion the US deficit to GDP is 10.2%.
The crisis in Greece began to unfold in November of 2009 when Prime Minister George Papandreou reported a higher than anticipated budget deficit at 12.7% of GDP. The two-year borrowing cost for Greece was less than 2% the first week of November. By May 7, 2010 it was over 19% and the Greek treasury was out of business.
 Greek Government 2-Year Borrowing Rate % (Source: Bloomberg)
 Greek Debt Maturities
The Bank for International Settlements (“BIS”) functions like a federal reserve bank for the federal reserve banks of the world. In March, 2010 it published a working paper entitled, “The future of public debt: prospects and implications.” The Abstract of the paper states, “Our projections of public debt ratios (debt to GDP) lead us to conclude that the path pursued by fiscal authorities in a number of industrial countries is unsustainable.” They could hardly be any clearer. It continues, “So far, at least, investors have continued to view government bonds as relatively safe." The report was released before the Greek meltdown.
“But bond traders are notoriously short-sighted, assuming they can get out before the storm hits: their time horizons are days or weeks, not years or decades. We take a longer and less benign view of current developments, arguing that the aftermath of the financial crisis is poised to bring a simmering fiscal problem in industrial economies to boiling point. In the face of rapidly aging populations, for many countries the path of pre-crisis (emphasis added) revenues was insufficient to finance promised expenditure.”
While the United States is not as sclerotic as Old Europe (graph 1 of the following panel) the promised benefits as a percent of GDP (graph 2) exceed all but Greece.

The report continues with a discussion of interest rates and growth rates. “The differential between the real interest rate and real output growth is a critical input parameter in determining the future evolution of public debt. When this differential is positive, so that the interest rate is greater than the growth rate, the debt ratio will explode (emphasis added) in the absence of a sufficiently large primary surplus.” And thus when borrowing costs spiked Greece found itself on the back side of the power curve.
A rational person would ask the question “Is the US next?”
Total US debt at May 31, 2010 stood at $12.992 trillion and the forecast deficit for FY 2010 is approximately $1.5 trillion. The CBO estimates Nominal GDP at $14.706 trillion which means at the end of the current fiscal year our public debt will stand at $13.6 trillion against a GDP of $14.7 trillion, a ratio of 92%. This does not include $1.65 trillion of Fannie Mae and Freddie Mac notes that, whether explicit or not, now seem to carry the backing of the Federal Government. Next year we will reach 99.7% and the CBO estimates deficits will continue as far as the eye can see growing at a faster pace than GDP until 2013 when GDP is expected to grow by an optimistic 6%. In 2016 deficits again start growing faster than GDP. And this year's $1.5 trillion deficit is 10.2% of GDP. Beginning to sound a lot like Greece.

But what is different is our debt distribution.
The Bloomberg graph that follows only picks up publicly traded debt and excludes that $4.5 trillion held in Intergovernmental Accounts, primarily money borrowed from the Medicare and Social Security trust funds. The CBO understates the debt to GDP by excluding this debt from its calculations. It will be depleted over time and replaced by public debt, so in calculating the ratio of maturing debt to total debt I use the total debt number of $12.992 trillion at May 31, 2010. The maturities of the intergovernmental debt are not available. That said the $2.2 trillion in public debt maturing in 2010 represents 17% of total debt. In other words we are far more sensitive to a run on our debt, or simply an increase in rates, than was Greece.
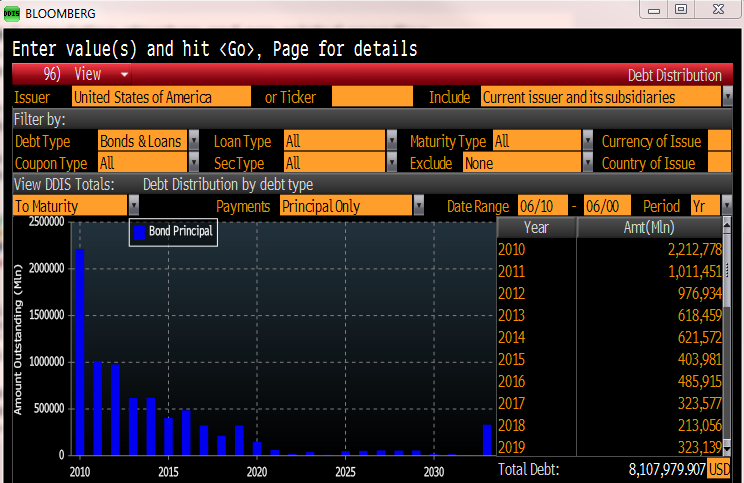 U S Debt Maturities
The President’s budget forecast calls for 2.8% GDP growth in FY 2011. Even a modest increase in short term borrowing costs, say to 3%, runs the significant risk the differential between borrowing costs and GDP growth could easily become positive. The CBO’s forecast for 2015 GDP growth is 4.6%. Three month Treasury Bill rates are forecast to be 4.6% and ten year Notes at 5.5%. With 45% of US debt re-pricing between now and 2015 and public debt increasing from the current $8.1 trillion to $14.3 trillion it is only a matter of time until we find ourselves, like Greece, on the back side of the power curve. Then the question is "how far is the ground?"


No comments:
Post a Comment