Saturday, January 1, 2011

Rising Star; Is China the New IMF?

In November of 2000 the U. S. Treasury and the International Monetary Fund together provided $18 billion to bail out Argentina. The economy had collapsed and Argentina was on the verge of defaulting on its debt. In exchange the government agreed to austerity measures; spending cuts, deregulation of their pension system and tax hikes. At the time a retired Argentinean was quoted, “We can’t go on living like this. The government promised us change, but all it has done is deepen the problems of those most in need.”

By December 2001 Argentina was back. The IMF refused to provide another round of funding and, in 2002 Argentina became the largest default in world history. The renegotiation process extended from the default through 2005 ultimately costing the world $137 billion.

The Argentinean default was preceded by ten years of lending by U. S. banks and the IMF culminating in the 2000 bailout. Beginning in 1991 re-negotiations followed in 1992, 1996 and 1998. But after failing to get new funding public debt exploded from 63% of GDP to 150% from December 2001 until the 2002 default.

For the last century America has used its balance sheet to effect its policies around the world. The Bretton Woods monetary system in 1945 created the IMF dominated by the United States, then the financial powerhouse of the world. The IMF became an extension of the U. S. financial system. In 1971 the United States defaulted on its obligations to the IMF and the world by unilaterally removing the dollar from gold convertibility and establishing the paper dollar as the world reserve currency.

American hegemony started under Woodrow Wilson when the New York banks, led by the House of Morgan, financed the allied powers against Germany. It continued into the 21st century to finally be undone by America’s entry into its own financed war with Iraq. That war and the attendant policies of the Federal Reserve and Congress set the stage for the 2008 financial collapse.

The irony is the very same banks that launched a century of ever expanding leverage, who were complicit with government in bringing on the 2008 collapse are now the biggest beneficiaries of government policies to assuage the pain.

The slow motion unraveling of the European debt crisis looks like a replay of Argentina and a prelude of what could easily occur here in the United States over the next ten years.

China has replaced the U. S. as the leading financial power in the world. With a $2.7 trillion International Investment Fund, China's fund dwarfs the balance sheet of the IMF which stands at 240 billion Special Drawing Rights (SDRs), equivalent to approximately $370 billion.

And now China has stepped into the EU crisis with an offer of aid.

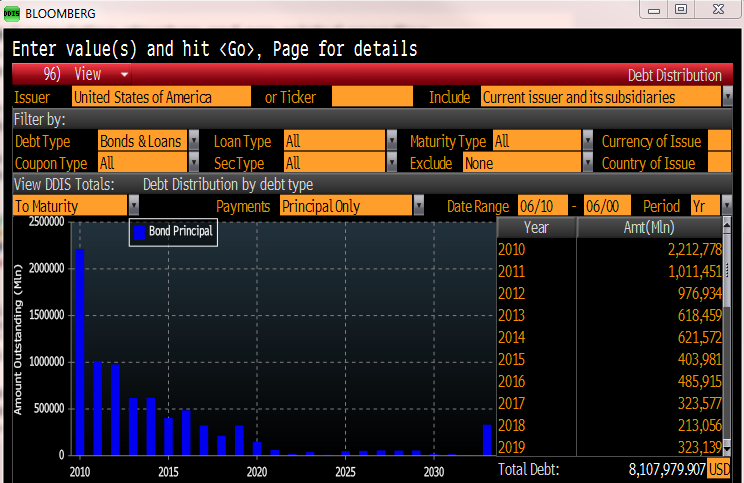
The United States today looks like a third world country. On October 30, 2010, the end of our fiscal year, total debt stood at $13.5 trillion versus a $14.7 trillion GDP. That doesn’t include $3.2 trillion owed by Fannie Mae and $2.3 trillion by Freddie Mac.

In March 2010 Congressman Barney Frank claimed the two agencies obligations are not sovereign debt. If not why did Treasury spokeswoman Meg Reilly only one month earlier reiterate, "As we said in December, there should be no uncertainty about Treasury's commitment to support Fannie Mae and Freddie Mac as they continue to play a vital role in the housing market."

As the Treasury continues to pour hundreds of billions of taxpayer dollars into the two agencies it would be fair to ask, “Is it or isn’t it?” If it is, total sovereign debt guarantees today stand at 130% of US GDP growing at over $1 trillion per year.

The actual operating deficit in the U. S. for the fiscal year ending in October 2010 was over $2 trillion. Inter-agency transfers reduced that number to $1.2 trillion. And none of this recognizes a $30 trillion unfunded liability for the Social Security Trust Fund nor the cost of the new health care bill.

Over the years each time U. S. banks and the IMF provided funding for a failing government they extracted promises. Those promises uniformly included reduction of public expenditures on entitlements and operating budgets, increases in taxes, requirements to open markets and agreements to stabilize their currencies, usually with some sort of peg. For the lenders, getting paid back in a worthless currency is almost as big a risk as not getting paid back at all.

So as China flirts with bailouts for the EU nations it is worth noting the EU is extracting exactly those same commitments from its client states. This sets China up as lender of last resort with the negotiations already done.

Shortly the client states of the United States may approach default. California is potentially the largest but an editorial in the Wall Street Journal suggests New York might be first. And then there are Illinois, Michigan and New Jersey each on the verge. However it unfolds the Federal Government’s balance sheet is in no shape for bailouts and it is unlikely a Republican congress will take kindly to blue states asking for financial support.

As Chairman Bernanke continues to leverage the balance sheet of the Federal Reserve, it will only take a singular moment of fear to lead to panic sending interest rates higher, or a push of the button on a computer keyboard for capital, now leaving the United States at a modest pace, to flee.

In a year end interview on Bloomberg Television Bill Gross, head of Pimco said, “The present is a good time to get out of the dollar and into currencies that hold value going forward…”

When the raiders of the currency come over the wall there is no defense but to raise interest rates. And when interest rates rise default is on the doorstep.

Then the question becomes what concessions do we make and how much will we have to pay for China’s International Investment Fund to buy our debt.

Tuesday, November 30, 2010

Health Care; Does Anybody Really Care?

As we say on the farm, “the chickens eventually come home to roost.” So it is with the Obama health care plan. Last November I pointed out in my blog “Health Care Part II…” that there were two bills introduced by Rep. Nancy Pelosi covering health care.

The first was the bill itself which supporters argued would cost no more than $1 trillion. This was made possible by including cuts in payments to physicians and other medical service providers under SGR, the Sustainable Growth Rate provision of Medicare designed to control health care provider compensation costs. The second bill was H.R. 3961, the Medicare Physician Payment Reform Act.

In order to hit the President’s target, the first bill included the SGR payment cuts. The cuts under SGR would have taken reimbursement rates back to what they were in 1990. So through sleight of hand H.R. 3961, scored by the CBO at a cost to taxpayers of $200,000,000,000 (yes $200 billion) was also introduced. It reinstated the SGR cuts but was not considered part of health care; pardon me?

H.R. 3961 finally passed but by the time it did it had absolutely nothing to do with physician pay. Through the alchemy of the congressional rules process it became an act to “extend expiring provisions of the USA Patriot Improvement and Reauthorization Act of 2005…” So the funding to offset the SGR cuts was crammed into a Continuing Resolution delaying the 21% scheduled physician pay cut through February 2010.

On February 25, 2010 soon to be censured Rep. Charlie Rangel (highlighted in the afore mentioned blog) introduced another bill delaying the SGR adjustment to November 30, 2010 with a 2.2% increase in payments. The Department of Health & Human Services finally reported the cost of these adjustments for FY 2010 at $11.7 billion or $1 billion per month.

Today the can was kicked down the road again but only one month delaying the cuts to December 31, 2010. The leg is getting weak. And according to the recently released draft of the President’s Fiscal Commission the fix is now going to cost $276,000,000,000, 38% more than just a year ago.

So that we are all clear, the health care bill that was supposed to cost only $900,000,000,000 when it was passed in March is actually going to cost $1,176,000,000,000 at a minimum and that is after only 6 months.

Here come the chickens.

Sunday, June 20, 2010

CalPERS Smoothes, Taxpayers and Ratepayers Take the Lumps

Last year the pension funds managed by CalPERS lost 23.5% of their value or $55 billion. At that point the largest fund was only 58.4% funded, well below the threshold of 80% which the CalPERS Board established in 2005 as the minimum level to be considered funded. CalPERS actuaries are taking the position the market sell-off was a onetime event and are amortizing the loss over 30 years.

Before his resignation, Dave Gilb, Personnel Administration Director and a CalPERS board member in a letter last June said the State’s contribution for 2010 including amortizing that loss would be $879 million. But in November, the CalPERS Board decided to postpone a decision and by early May of this year had settled on a $600 million increase in the contribution to $3.9 billion. Absent from that increase was the majority of the $879 million. $300 million of the increase is a result of an actuarial update showing a longer average life expectancy of State employees, $50 million is to cover earlier than anticipated retirements and $200 million was already anticipated because of earlier underfunding. ( The fund lost 5.8% between June of 2007 and June of 2008.) Instead, using a three year smoothing method that loads the largest contributions into the second and third years, the contribution made towards actually covering that loss will be around $115 million. There was a savings of $50 million from lower than anticipated salaries. Last week the CalPERS committee made it official and sent their recommendation to the board. A chart given to the CalPERS Board last spring showed that after the three year smoothing, contribution rates for most workers are expected to slowly climb for three decades, going from roughly 17 percent of payroll in 2012 to 27 percent by 2042. And the result is that by 2042 the plan will only be 76% funded.

The municipalities and agencies participating in CalPERS are a microcosm of the larger fund. The difference is they receive their actuarial adjustments a full year after the State and two years after changes in the fund occur. This has the effect of making people like me appear to cry wolf. It gives the municipal managers the ability to claim they are “fully funded” because by the definition of the actuaries at CalPERS they are. In fact they are two years behind.

The chronology of events leading up to this is pretty clear. In 1991 then Governor Pete Wilson signed legislation bringing the analysis and funding of CalPERS under the responsibility of the legislative and executive branches and reducing pension benefits. That was followed quickly in 1992 by a labor sponsored initiative, Proposition 162, approved by 51% of the voters, which returned control of the pension funds to the CalPERS actuaries. In 1999 CalPERS position was further strengthened and retirement benefits increased by SB 400, legislation written and sponsored by CalPERS and signed into law by Governor Grey Davis, which laid the groundwork for the now infamous 3% at 50 for safety employees.

Suffering from the collapse of the tech boom, in 2003 CalPERS lowered their assumed rate of return from 8.25% to 7.75% where it stands today but that created a problem. After the typical delays for actuarial calculations, by 2005 plans were underfunded so in 2005 the Board widened the band they consider funded from 90-110% to 80-120% giving cover to the plan managers in professing that their plans are “fully funded”. Today they are amortizing losses over longer periods of time, back loading payments required by their own actuarial assumptions and trying to correct their actuarial miscalculations.

For MMWD, and it seems consistent across most of the funds I look at, the elephant in the room is Other Post Employment Benefits or OPEBs, those other than direct pensions. There are two funds for pension liabilities. The first is direct pension payments which is on balance sheet and funded each year by the amount required by CalPERS. This is the contribution we are talking about today. Terry Stigall, the CFO of the MMWD told me last week this year’s contribution to the pension only part of the plan For MMWD will be 13.86% of covered salary or roughly $2.85 million. In addition they will make the entire employee contribution for senior managers of 8% and 3% of the 8% for all other employees bringing the total contribution to roughly 18% of covered payroll. The second fund is OPEBs which in the past was carried off balance sheet. Put in motion by the Government Accounting Standards Board Statement 45, beginning in 2009 municipal funds had to account for the future liability of OPEBs, something they had been simply funding on a cash basis before. In the Notes section of MMWD’s 2009 audited financials in reference to these liabilities it says, “As of January 1, 2007, the most recent actuarial valuation date, this plan was not funded. The actuarial accrued liability for benefits was $33,973,000, and the actuarial value of assets was $0.” In 2009 contributions to the two plans amounted to $7,408,610 or 39.3% of covered payroll and 12.66% of the total operating budget. This does not include Social Security, Medicare or any other taxes related to employment or any benefits associated with direct employment. Here is the schedule I got directly from MMWD. It demonstrates the effects of amortization of liabilities over 30 years. In unadjusted dollars the liability is actually higher after the first ten years than it was at the beginning. The payment for 2007-08 was not required and was not made and there appears to be no prevision for making it. The contribution for 2009-2010 will be $3.728 million. That means total contributions by MMWD for retirement benefits will equal about $7.928 million of a total estimated operating budget of $57 million or 13.9%. What is particularly of concern is that it is 1.2% higher as a percent of the total budget than it was last year and we haven’t even begun to deal with the losses incurred in the funds from the 2008-09 contraction!

In April of this year the Stanford Institute for Economic Policy Research published a report entitled, “Going for Broke: Reforming California’s Public Employee Pension Systems.” In it they argued the discount rate used in calculating the funded status of the three main pension funds managed by the public employee pension system is too high and the funds are in significantly worse shape than being reported. The discount rate is one of the inputs actuaries use in determining the funded status of plans. It is the assumed future returns of the plan. While there are a lot of variables; for example length of employment and lifespan of participants and their spouses, which apparently the actuaries have been getting wrong anyway, the two biggest variables are investment returns and inflation. The Stanford brief made the case taxpayers should not be responsible for miscalculations in fund returns or for inflation and therefore the investment rate should be the risk free rate and went so far as to suggest the use of TIPS, Treasury Inflation Protected Securities. In their argument against the assumptions used by the Stanford report CalPERS pointed to their historical returns. In the last 20 years these returns have averaged 7.91% and the number used by the actuaries for future returns is 7.75%.

On March 5 of this year an article appeared in the Wall Street Journal suggesting CalPERS may drop this rate to 6%. The result would cause an increase in unfunded liabilities by at least 15% as we saw in 2005.

So it would be reasonable to ask if these returns are achievable. In calculating their returns CalPERS uses 20 years. The only data available on historical fund returns I could find was from the annual reports posted on their web site and they only went back as far as 2002. Over that eight year period the average return was 3.44%. That means the average return for the twelve years leading up to 2002 had to be 15.5%. It also means that to achieve an average return of 7.75% for the period from 2002 to 2022 the next 12 years average also has to be 15.5%. I believe that will be quite a feat.

On April 7 they felt pretty good arguing against the Stanford brief. Year to date returns for the fund were 15.53%. However as you can see in the next panel by June 14, 2010 they were down over 4% leaving them with a return to date of 11.61%. And typically the largest returns, particularly in the stock market occur in the first year of recovery from a contraction. The Standard and Poor’s 500 is up 19.5% over that same time period.

I can almost hear the prayers for a quarter end rally before they close their year.

I would also put forth the proposition that the kinds of returns they anticipate over the next ten years are unachievable for several reasons.
  • First, during the period from 1990 through 2001 US debt to GDP averaged 62%, the CBO forecasts debt to GDP to average 96% over the next eleven years (the twelfth year is not available but year eleven is the highest at 101% and increasing). The Bank for International Settlements (BIS) which is the international equivalent of the Federal Reserve, released a report in April entitled “The Future of Public Debt, Prospects and Implications” in which they make the case that once a country exceeds 90% debt to GDP they can expect GDP to be reduced by approximately 1% from what it might ordinarily be.
  • Second, in their book “This Time Is Different” Carmen Reinhart and Kenneth Rogoff demonstrate how historically, severe contractions like we experienced in 2008 to 2009 are not easily overcome and the effects are around on average for ten years before reasonable economic growth reignites and that countries such as the US, with its high level of debt to GDP are inevitably forced to default on their debts either by devaluation or inflation before growth resumes.
  • Finally the period when CalPERS achieved their superior returns was during a time there were significantly more employees paying in than taking out. Today the inflows are only slightly ahead of outflows and will turn negative before long. This is exactly what happened to the General Motors pension plans and brought General Motors down.
This brings up the second risk in the actuarial model, inflation. In calculating funding requirements the actuaries use an assumed inflation rate. For CalPERS it has been 3% but they appear to have reduced it recently to 2.5% according to a comment made by Joseph Dear the CalPERS Chief Investment Officer. If that is so they have further improved the calculation for unfunded liabilities because keeping the investment returns the same and reducing the assumed rate of inflation boosts real returns. And while 2.5% may seem high by today’s standards don’t be so sure. Even during the Great Recession the annual inflation rate only dipped below zero in the middle of 2009 and is already back up to 2.2%. Mr. Bernanke is promising us no deflation and if I were to bet on one thing he might get right that would be it.

So the bottom line to me is this: if CalPERS is so confident they can achieve these returns and they can forecast the risk of inflation along with all the other variables associated with their actuarial shenanigans, why aren’t the public employees willing to take that risk instead of placing it on the backs of the rate payers and the taxpayers? You might agree but again Joseph Dear, the Chief Investment Officer of CalPERS weighs in, “…I might agree with the money managers, who tend to have a short-term investment horizon, that earnings may average 6% in the short term. But CalPERS has decades in which to repeat its past investment performance.”

Do they?

Friday, June 4, 2010

Debt and the Back Side of the Power Curve: Will the US Follow Greece?

An airplane accelerating down the runway reaches a critical speed where enough air is forced over the wing to create lift. The airplane rotates and takes off. As long as the speed of the plane stays above that point and power is applied it will accelerate. As it slows it behaves differently. On the graph below is a point called Minimum Power Airspeed. From there on, as the aircraft decelerates more power must be added to maintain altitude. The wing approaches stall, ceases to fly and the only alternative is to push the nose towards the ground. Too close to the ground and the outcome is inevitable. In aviation this is called the back side of the power curve.

There is an economic relationship very similar to the power curve. This is the relationship of debt to GDP and, more precisely, the relationship of debt service to GDP growth.

Greece is on the back side of the power curve. What happened?

On the surface Greece is not much worse off than the United States. The public debt of Greece is 108% of GDP. In the US it is 90% including intergovernmental holdings of $4.5 trillion made up primarily of borrowings from the Medicare and Social Security trust funds but owed none the less. With an estimated deficit of $1.5 trillion the US deficit to GDP is 10.2%.

The crisis in Greece began to unfold in November of 2009 when Prime Minister George Papandreou reported a higher than anticipated budget deficit at 12.7% of GDP. The two-year borrowing cost for Greece was less than 2% the first week of November. By May 7, 2010 it was over 19% and the Greek treasury was out of business.

Greek Government 2-Year Borrowing Rate % (Source: Bloomberg)

Economic growth is the engine that drives a country. Tax revenue is the available power and debt is the drag. What brought Greece to its knees was short term borrowing cost. Greece’s debt distribution is reasonably good. A look at Bloomberg shows only $7.33 billion maturing in 2010 or roughly 2.4% of a total $310 billion. The rest is spread out almost evenly over the next 10 years.

Greek Debt Maturities

The Bank for International Settlements (“BIS”) functions like a federal reserve bank for the federal reserve banks of the world. In March, 2010 it published a working paper entitled, “The future of public debt: prospects and implications.” The Abstract of the paper states, “Our projections of public debt ratios (debt to GDP) lead us to conclude that the path pursued by fiscal authorities in a number of industrial countries is unsustainable.” They could hardly be any clearer. It continues, “So far, at least, investors have continued to view government bonds as relatively safe." The report was released before the Greek meltdown.

“But bond traders are notoriously short-sighted, assuming they can get out before the storm hits: their time horizons are days or weeks, not years or decades. We take a longer and less benign view of current developments, arguing that the aftermath of the financial crisis is poised to bring a simmering fiscal problem in industrial economies to boiling point. In the face of rapidly aging populations, for many countries the path of pre-crisis (emphasis added) revenues was insufficient to finance promised expenditure.”

While the United States is not as sclerotic as Old Europe (graph 1 of the following panel) the promised benefits as a percent of GDP (graph 2) exceed all but Greece.


The report continues with a discussion of interest rates and growth rates. “The differential between the real interest rate and real output growth is a critical input parameter in determining the future evolution of public debt. When this differential is positive, so that the interest rate is greater than the growth rate, the debt ratio will explode (emphasis added) in the absence of a sufficiently large primary surplus.” And thus when borrowing costs spiked Greece found itself on the back side of the power curve.

A rational person would ask the question “Is the US next?”

Total US debt at May 31, 2010 stood at $12.992 trillion and the forecast deficit for FY 2010 is approximately $1.5 trillion. The CBO estimates Nominal GDP at $14.706 trillion which means at the end of the current fiscal year our public debt will stand at $13.6 trillion against a GDP of $14.7 trillion, a ratio of 92%. This does not include $1.65 trillion of Fannie Mae and Freddie Mac notes that, whether explicit or not, now seem to carry the backing of the Federal Government. Next year we will reach 99.7% and the CBO estimates deficits will continue as far as the eye can see growing at a faster pace than GDP until 2013 when GDP is expected to grow by an optimistic 6%. In 2016 deficits again start growing faster than GDP. And this year's $1.5 trillion deficit is 10.2% of GDP. Beginning to sound a lot like Greece.


But what is different is our debt distribution.

The Bloomberg graph that follows only picks up publicly traded debt and excludes that $4.5 trillion held in Intergovernmental Accounts, primarily money borrowed from the Medicare and Social Security trust funds. The CBO understates the debt to GDP by excluding this debt from its calculations. It will be depleted over time and replaced by public debt, so in calculating the ratio of maturing debt to total debt I use the total debt number of $12.992 trillion at May 31, 2010. The maturities of the intergovernmental debt are not available. That said the $2.2 trillion in public debt maturing in 2010 represents 17% of total debt. In other words we are far more sensitive to a run on our debt, or simply an increase in rates, than was Greece.

U S Debt Maturities

The President’s budget forecast calls for 2.8% GDP growth in FY 2011. Even a modest increase in short term borrowing costs, say to 3%, runs the significant risk the differential between borrowing costs and GDP growth could easily become positive. The CBO’s forecast for 2015 GDP growth is 4.6%. Three month Treasury Bill rates are forecast to be 4.6% and ten year Notes at 5.5%. With 45% of US debt re-pricing between now and 2015 and public debt increasing from the current $8.1 trillion to $14.3 trillion it is only a matter of time until we find ourselves, like Greece, on the back side of the power curve. Then the question is "how far is the ground?"

Saturday, April 10, 2010

Stanford Meets MMWD; Bleeding Red Ink

On April 2, 2010 the Stanford Institute for Economic Policy Research released a policy brief entitled, “Going For Broke: Reforming California’s Public Employee Pension Systems.” It was an interesting attempt to deconstruct the problems facing the taxpayers of California. It is in stark conflict with the official report.

The officially stated unfunded liability of CalPERS at July 1, 2008 was $38.6 billion. Using the methodology of the Stanford graduate students it rises to $239.7 billion. Total pension obligations covered by CalPERS, CalSTRS and UCRS rise to almost $425.2 billion. In July of 2008 things still looked fairly good.


To calculate the amount of money necessary to fund a future liability a rate of return or discount rate is required. This is what an investment would expect to return over its lifetime. Using Excel enter a future liability (for example the cost of a child’s college education) enter the years until that obligation is due then guess on what your rate of return on an investment will be. The result is the “present value” of that future liability. By subtracting the money actually available for investment from the present value of the liability the unfunded status is apparent.

In calculating a rate of return there are many opportunities. Let’s say you are John Paulson , you might choose 20% or 100%. If you are the Social Security System you will choose U S Treasuries which return a lot less.


Here is where the mandarins of CalPERS sit while they calculate. They have come to the conclusion they will make 7.75%. Wikipedia points out their assets peaked in October 2007 at $260.6 billion and, as of December 2008, were down 31% to $179.2 billion. Ooops!

What makes the brief from SIEPR important is its reflection on the appropriate assumed rate of return for a publicly funded pension plan. Case law in California establishes the immutable right of the employee to vested benefits. The brief argues that therefore the investment returns should likewise be immutable, in other words without risk of loss. And the place to go for that is U S Treasuries. While the brief was generous by assuming a return of 4.14% at 10 years (the available return at the time in U S 10 year Treasury Notes was 3.625%) it also points out a flaw in its own assumptions. The immutable returns to employees covered by CalPERS are indexed to inflation. As an alternative the Treasury also offers Treasury Inflation Protected Securities or TIPS eliminating inflation risk. On April 5, 2010 the U S Treasury auctioned 9 year 9 month TIPS Notes at a high yield of 1.709%. When calculating unfunded liabilities CalPERS assumes inflation will run 3%. I have suggested to Joe Nation, the faculty adviser on the paper, a more appropriate rate might be the assumed inflation rate plus the TIPS rate. It still comes up to only 4.709%.

The Marin Municipal Water District is a microcosm of the State. As a participant in CalPERS, the value of pension assets rises and falls with the portfolio of CalPERS. In previous blogs I have outlined the problems faced by MMWD and estimated the total unfunded position at over $90,000,000. That number would pale to insignificance at a discount rate of 4.709%.

Pension liabilities accrue for a couple of reasons. First there are the promised benefits. Created by legislation, written and sponsored by CalPERS in 1999, the road map was clear. In 1999 you can only imagine the heady feeling among the managers of California’s pensions. Approaching the peak of the tech bubble pension funds were swollen, overfunded to a degree unimaginable only a few years earlier. Contributions by participants were reduced and in some cases returned. It appeared the good times were here to stay and as a reward covered employees were granted extensive retirement benefits. For example the legislation established an accrual and retirement formula of 2% at 55. It means that for each year worked a benefit of 2% of the base, the average of the last three years salary, accrued and was fully vested at age 55. This became the standard for California public employees (other than safety employees who hold a special place in our hearts and received 2.5% at 50) and the assumed rate of return was 8.25%. Amid the economic turmoil of 2003 CalPERS reduced that rate to 7.75% where it stands today.

Markets rise and fall and by 2006 jubilation once again walked the halls of the Lincoln Plaza Complex at 400 “Q” Street. Buoyed by outsized investment returns and tax inflows from the housing boom, municipalities and agencies around the state upped the ante raising benefits to 2.7% at 55 for non safety employees and 3% at 50 for safety employees. Meanwhile union negotiators whittled away at the calculated base, the average of the last three year’s pay. Adding to the employees good fortune, boards charitably adopted only the last year’s pay as the benefit standard, opening the way for well documented abuses. Around the state ratepayers and taxpayers slept.

Once benefits are established the driver becomes investment returns. Again we consult with the mandarins, the managers of California’s retirement funds. The question of appropriate rates of return was the focus of a recent interview with CalPERS Chief Investment Officer Joe Dear and Alan Milligan, CalPERS Interim Chief Actuary. Apparently immune from the randomness faced by the rest of the world Alan Milligan weighed in, "…as Actuaries, we need to know not just what’s going to happen in the next ten years, but also what is going to happen in the next 50 years.” In Alan’s world there are no black swans. And if there are, well the taxpayers and the ratepayers are standing by.

I do not have the capacity to calculate the estimate produced by the Stanford graduate students who authored “Going For Broke” but if I apply the same ratio used with CalPERS to MMWD’s unfunded liabilities as they existed at the end of the 2007 fiscal year it looks like this:


Simply put the bill staring the ratepayers of MMWD in the face could be in the neighborhood of $300,000,000! However it is couched, whether by distributing it over thirty years, manipulating it, or massaging it with actuarial assumptions for investment returns, the ratepayers of MMWD will be facing regular rate increases forever.

For those who feel lost my sympathies are with you; however there is a glimmer of hope. First there is now a lot of attention focused on MMWD and the performance of the board members we have elected to guard our interests. Next, if you travel up 101 north a few miles you will run into the community of Novato and the Novato Sanitary District. I Googled them and the first thing I noticed was their organization chart. Unlike MMWD’s which has the Board at the top, sitting above the NSD Board of Directors is a box entitled “NSD Ratepayers”. What a novel concept. I knew their Board, over the strong opposition of the unionized work force, had made the decision to contract the operation of a newly completed water treatment facility to an outside company, a move designed to save the ratepayers $7 million over the life of the 5 year contract . It is not without challenges and the biggest is coming from labor, the root cause of our current problems. But it was a courageous board that voted to eliminate a number of expensive union positions in favor of a lower cost option; outsourcing.

But the most impressive moment for me was a conversation I had with Beverly James, the Engineer-Manager of the district. When I pointed out the problems at MMWD with OPEBs (Other than pension Post Employment Benefits) she said her board has been concerned about them for a long time. Contrast that with the MMWD board's view. From Section F8 of "Response to Marin County Civil Grand Jury Report on Retire (sic) Health Care" prepared by General Manager Paul Helliker and supported by the current board by a vote of 4-0, "MMWD believes that public agencies should always be prudent when managing public funds. However, MMWD does not think it is beneficial to speculate on what may occur in the future."

While Novato Sanitary is under the same accounting rules governing all public entities for reporting unfunded liabilities, they chose a discount rate of 4%, a number even more conservative than was used in the Stanford brief. They have moved to reduce their exposure to OPEBs by going to a two-tiered system for retiree medical benefits adopting a defined contribution plan for employees hired after July 1, 2008. The District contributes 1.5% into a 401a for those employees instead of providing a defined benefit. And when the rest of the State was increasing pension benefits to employees, the Board of the Novato Sanitary District held the line at 2% at 55, still generous by private standards but more manageable than most of California. Engineer/Manager James gave credit for the ratepayer centric focus to board president Mike Di Giorgio. Mike, your performance is a shining light in an otherwise dim landscape and Novato you are very fortunate.

So it is clear that competent and responsible individuals exist in the communities they are elected to serve. There are hurdles to overcome. First candidates must be identified, then they must be elected and that seems to be only the beginning as the challenges to the Novato Sanitary District’s board show. But we have been warned ahead of time that “Eternal vigilance is the price of liberty.”

The ratepayers of MMWD deserve better governance and the coming election provides the opportunity to claim it.
________________________________________________

Next: Is the board of MMWD trying to circumvent voters opposed to the desalinization plant with the creation last week of the Marin Municipal Water District Financing Authority?

Monday, March 1, 2010

I Correct a Misstatement; MMWD Kicks the Can Down the Road


On February 24 I spoke at the rate hearing for the Marin Municipal Water District.[1] At that meeting I referred to the total unfunded retirement benefits and said, "If we had to fund it today it would cost $92,000,000 which is 130% of the entire MMWD annual budget. And there is no plan in place to pay for it!”

I was wrong on two counts. First the hole is likely larger, which I will explain in a moment. Second, and of greater significance there is a plan in place. That may be the bad news. The plan is like a game many of us played as kids called kick the can. In this case they just keep kicking it down the road.

This is not the plan of Terry Stigall, MMWD’s head of finance or the Board although there appear to be funding choices and MMWD has adopted the most lenient. It is the plan of accountants and actuaries.

At January 1, 2007 the Unfunded Actuarial Liability (UAL) for OPEBs (Other Post-retirement Employee Benefits than pensions) was $33,973,000, which is the number I used in my calculations for the rate hearing. The plan to fully fund this, supplied by the actuary, spreads the process over 30 years and assumes the assets of the plan are held in trust and earn 7.75% per year.[2] A contribution of $3,497,000 was to be made at the end of 2008. The estimate for the UAL at that point was $35,177,000 which is $1.2 million more than I said. And the 2008 contribution was not required and was not made. Instead only the actual benefits were paid in the amount of $1,355,893. Until the actuaries speak, which will be at the end of this year or the beginning of next, we will not know where we stand. Medical costs were lower than projected and investment returns, at least for the last 6 months, were higher. That is the good news. The bad news is that over the next 10 years, under the “funding” plan the UAL goes up not down.

From the report, “The Unfunded Actuarial Liability in 10 years is projected to be approximately $38.5 million if the District pre-funds. The difference will be more dramatic after 2016/17, with the projected June 30, 2037 Unfunded Actuarial Liability expected to be $0 under the pre-funding approach (Unfunded Actuarial Liability amortized over 30-year period).” And every two years the actuaries will weigh in with a new estimate, again for 30 years. Will therel be a new 10 year period that looks more or less like this one? Rate payers might reasonably ask, how long is the road ?


Actuarial calculations require many assumptions including the direction of health care costs, an inflation rate, in this case 3% and from CalPERS an investment return of 7.75%. The March 1, 2010 issue of the Wall Street Journal carried an article about CalPERS and their prospective investment returns. They may soon drop their assumption to 6%.[3] The impact of that on UALs will be dramatic. At 10 years it will reduce the investment returns by roughly 15% which means a significant boost to required contributions. As we can see from the table above, upward pressure on water rates will continue each year anyway. If the actuaries are forced to lower their investment return assumptions, that upward pressure will increase from rising contributions to both the pension fund and the OPEBs. In 2009 contributions to the two plans amounted to $7,408,610 or 39.3% of covered payroll and 12.66% of the total operating budget.[4] This does not include Social Security, Medicare or any other taxes related to employment or any benefits associated with employment. And the costs just keep going up.

Out-sized benefits are at issue. The rate payers not only fund all these future entitlements for retirement at 55 and early retirement at 50, they also guarantee the investment performance of CalPERS. The average age of MMWD employees is 47. Retirement is in sight and the burden of those retirement benefits will fall squarely on the shoulders of the ratepayers. The Board of MMWD has clearly failed its fiduciary responsibility to the ratepayers it was elected to protect. Unless that changes it will be a long, long road.

_____________________________________________________________________

[1] http://unfundedliabilitiesandclasswar.blogspot.com/search/label/MMWD%20Citizens%20night

[2] http://files.e2ma.net/1401763/assets/docs/other_post_employment_benefits__opeb__valuation_executive_summary_-_6-30-07.pdf

Saturday, February 27, 2010

Citizen's Night at the Marin Municipal Water District

In my last blog I “went local”. I didn’t anticipate the ramifications. Going local creates access. My blog readers know me, they know how to reach me, and now I have excited a nerve and it needs to be scratched.

After a brief collaboration with friends I was enlisted to make a presentation to the local water district board, MMWD, which I had written about in my previous blog. In preparation I did my due diligence. I met with Paul Helliker, MMWD’s General Manager and Terry Stigell, the CFO. Terry was prepared with copies of my blog in hand appropriately highlighted as only Adobe Acrobat can do.

Wednesday, February 24 came too quickly. I spent the previous Sunday, ten hours of it, trying to normalize the rates the various districts charge their customers.[1] After making numerous requests to the president of the board for a larger block of time than the allotted three minutes, I was notified I would get the same three minutes as everyone else. How do you compress fifteen complicated minutes into three? It quickly became clear the procedures work to the incumbents’ benefit.

I rewrote my presentation[2] into bullet points. I downloaded a stop watch to my desktop and practiced my delivery over and over. No matter how I changed it fifteen seconds before I reached my climatic conclusion the buzzer went off. And no matter how many times it happened the sound of that buzzer was like an electric shock! OK, maybe I can ask for more time.

I drove to the meeting with my wife, Lorilei, and my good friend Bill Tunney. (I say good friend because who else would endure such an evening?) There was also a cadre of my blog supporters, those who had pressed me into this position. I'd made up a set of presentation materials. [3] picked up from Kinko’s only hours before, to pass out to those in the room. Tonight’s the night!

We arrived early to sign up for public comment. I thought if I got there early enough and signed in I would be high on the agenda. Foolish me. The incumbents are in charge and they deftly moved my card to the position of last speaker. Ah the power of being in charge.

Not knowing this I wait, thinking as each name was read mine would be next. I watch as people leave the room. Apparently the reporter from the Marin Independent Journal was one of the first because his write-up of the meeting was both inaccurate and incomplete. What hope do we have when we can’t even count on the fourth estate?

It’s now my time to present. I know my talk is three minutes and fifteen seconds, my internet timer told me so. The chair has been lenient and if I could just explain some of my slides a bit more they would have context.

I am at two minutes and fifty seconds and “Recommendations to the Board”. [4] I only have eight but it will take at least forty five seconds. I begin to realize I have lost to the incumbents. At number three the gavel sounds. Like the bell that went off on my internet timer it is like a shot of electricity. Doesn’t the board want to hear my recommendations? Aren’t they truly interested in the issues at hand? I look towards the sound of the gavel and see Jack Gibson. Flash back to fifth grade and a bully who wanted to control the playground. He has no interest in what I have to say. To him I am just one more rant he has to endure to advance whatever it is he has in mind. “What do we have to do to get him out of here,” says Jack. “Just listen to what I, a citizen and rate payer have as recommendations to you,” I think but don’t say. Instead I keep reading from my list. The gavel bangs again and there are shouts from the crowd. Are they for me or against me, I don’t know but finally I stop, bullied into silence by the gavel and unsure of the crowd. I walk back to my seat and the crowd erupts in a standing ovation. Twice I rise in acknowledgment embarrassed by the whole thing and wishing for the moment I could return to the anonymity of my blog. And then it is suddenly clear; there are three men present, one calling in by phone and a woman sick at home; they are the board and they are in control and there is nothing we or anyone else can do about it.

Nothing, that is, until the next election?

In my next blog I will apologize and explain why I was wrong about something I said regarding MMWD's unfunded liabilities. It turns out it may be worse.