Saturday, December 19, 2009

Health Care III, A Christmas Present?

On Saturday, December 19 Senator Harry Reid released legislative language for the Patient Protection and Affordable Care Act (PPACA) as Senate Amendment 2786. These are the changes proposed by the Senate to H.R. 3592. It is expected to pass in the Senate before Christmas. Included in the amended bill is a brand new government sponsored health insurance program that provides a perfect example of how Congress creates unfunded liabilities.

Introduced in March of 2009 by Senator Ted Kennedy it is known as the CLASS Act (Community Living Assistance Services and Supports Act)[1] and is designed to provide insurance for long term care. This program creates a new government entitlement supported by a brand new trust fund. In the beginning there are more people paying in than taking out but as more participants vest and begin receiving benefits, payments increase and eventually swamp the income. If it sounds familiar it’s because it is very similar to the scheme that bankrupted Bernie Madoff and General Motors and it operates just like Social Security, Medicare and the entitlement programs of the State of California. Consider this, an individual pays an average premium of about $65 per month for five years (a total of $3,900) and then becomes eligible for benefits. Participants are eligible for $50 per day towards their long term care or ten times the rate at which they paid in. That is $1,500 per month as long as they are alive! For the first five years there will be no beneficiaries only premium payers. Early in the program as the beneficiaries come on line there is still positive cash flow because there are more payers than recipients but eventually beneficiaries exceed the payers, the trust fund is exhausted and the program will begin contributing to the deficit. We know this today! Yet Senator Reid would have us believe that this program will contribute $72 billion towards “paying for health care.” Here are the Congressional Budget Office (CBO) figures.

This program’s contribution to paying for health care peaks in 2015 and begins declining as payments out begin to exceed premiums in. The CBO’s scoring of Senate Amendment 2786 states, “As noted earlier, the CLASS program included in the bill would generate net receipts for the government in the initial years when total premiums would exceed total benefit payments, but it would eventually lead to net outlays when benefits exceed premiums…in the decade following 2029, the CLASS program would begin to increase budget deficits.” Zingo, a brand new unfunded liability.

This sums up the problem with government, it is accounted for like a classic Ponzi scheme[3], in other words on a cash basis. Corporations are not allowed to use this accounting method. Unlike corporations which have to bring future liabilities onto their balance sheets our government is presumed to be perpetual and simply reports cash in and cash out. If accounted for on a GAAP basis (“Generally Accepted Accounting Principles”)[4] one analysis puts the real 2008 federal budget deficit at a staggering $5.1 trillion[5], not the $455 billion reported by the Congressional Budget Office.

Now let’s look at the rest of the CBO’s scorecard on the Senate amendment.


The total cost of the program has increased 20% from the Chairman’s Mark discussed in an earlier blog[6] or $100 billion above previous estimates. So again we ask, “How does this contribute to reducing the deficit?”

The single biggest savings comes from reductions in Medicare, Medicaid, and other programs in the amount of $483 billion. They are:
  • Permanent reductions in Medicare payment rates in the fee-for-service sector saving $186 billion
  • Adjustments to the Medicare Advantage program saving $118 billion
  • Reducing Medicaid and Medicare payments to hospitals serving large populations of low-income patients by about $43 billion
  • $28 billion comes from reductions in subsidies for non-Medicare Advantage plans and changes to payment rates recommended by an Independent Payment Advisory Board established by the legislation. These recommendations are non-binding.
  • CLASS (our afore mentioned Ponzi scheme) for $72 billion.
  • Improvements in disbursements by adopting and regularly updating standards for electronic administrative transactions which enable electronic funds transfers saving $11 billion.
The CBO offers this caveat, “These longer-term calculations assume that the provisions are enacted and remain unchanged throughout the next two decades, which is often not the case for major legislation. For example, the sustainable growth rate (SGR) mechanism governing Medicare’s payments to physicians has frequently been modified (either through legislation or administrative action) to avoid reductions in those payments, and legislation to do so again is currently under consideration in the Congress.” Readers will recall this as H.R. 3961, the Medicare Physician Payment Reform Act that reverses reductions in payments established by SGR. CBO estimates the cost of H. R. 3961 at $210 billion over the next 10 years[7] and this is not considered in the national debate as part of the cost of health care.

Hot off the press, the CBO today released a correction to the score it published on December 19 to wit, “Correcting that error has no impact on the estimated effects of the legislation during the 2010–2019 period. However, the correction reduces the degree to which the legislation would lower federal deficits in the decade after 2019.”[8] Oooops!

Have a Merry Christmas and caveat emptor.
_____________________________________________________
[1] http://thomas.loc.gov/cgi-bin/bdquery/z?d111:SN00697:
[2] http://www.cbo.gov/ftpdocs/108xx/doc10868/12-19-Reid_Letter_Managers.pdf
[3] http://en.wikipedia.org/wiki/Ponzi_scheme
[4] http://en.wikipedia.org/wiki/Generally_Accepted_Accounting_Principles
[5] http://www.wnd.com/index.php?fa=PAGE.view&pageId=113366
[6] http://2.bp.blogspot.com/_y3c1XyakSC0/StvBOIfkWyI/AAAAAAAAAfg/IEZ_KkZ0Bj0/s1600-h/Chairman%27s+Mark+chart8.jpg
[7] http://www.cbo.gov/ftpdocs/107xx/doc10732/HR3961_HonRyan.pdf
[8] http://www.cbo.gov/ftpdocs/108xx/doc10870/12-20-Reid_Letter_Managers_Correction1.pdf

Sunday, November 22, 2009

The California Debt Crisis, Sinking in Quicksand


As California seemingly sinks deeper and deeper into debt we have to ask the question, “How did we get here and can we fix it?” What follows is a discussion on the symbiotic relationship between elected government officials and public employee unions.

On May 23, 2008 the City of Vallejo filed a case seeking bankruptcy protection under Chapter 9 of the United States Bankruptcy Code.[1] In its filing it disclosed that the cost of public safety salaries represented 74% of its $80 million budget.[2] The average fireman in Vallejo takes home $170,000 while City Manager Joseph Tanner’s total annual compensation is more than $400,000.[3] And the response is to cut services not salaries.

Not far behind is the city of Bakersfield with its “3 at 50” retirement benefit. In 2001 Bakersfield’s city council voted to allow police officers and firefighters retirement pay equal to 3 percent of their best year’s salary for every year they worked, to a maximum of 90 percent. Their retirement eligibility begins at age 50.[4]

In 1999, in the transition between governors Pete Wilson and Gray Davis, California SB 400 was passed. Sponsored by the California Public Employees Retirement System and proposed by the Senate Public Employees and Retirement Committee it cleared that committee by a vote of 4-0. It cleared the Senate Appropriations Committee 11-0 and passed on the Senate floor 35-0. In the Assembly it garnered only 7 nays to pass and become law on September 10, 1999 by a vote of 70 ayes to 7 nays. This bill established a new level of survivor benefits for state and school employee participants comparable with Social Security and made significant increases to the benefits of state and school employees. Among others it provided for retirement at age 50 and cost of living adjustments. Benefits were increased even more for “safety” employees, that is state police and firefighters.[5] It became a mammoth unfunded liability and the model for municipalities around the state.

Hit by the twin financial downturns caused by the dot-com bust and 9/11, Governor Gray Davis struggled with mounting deficits and a dysfunctional budgetary system. Finally, blamed for the electricity crisis that hit California, Davis was recalled in 2003. He was replaced by Arnold Schwarzenegger who ran on a campaign of fiscal responsibility. When the state legislature rejected his spending limit proposal a compromise was struck and Proposition 58 requiring a balanced budget appeared on the March 2004 primary ballot and was approved by the voters. Still the deficits persisted and the pessimistic forecasts became reality.


Spurned by the state legislature but emboldened by his election victory Schwarzenegger turned to the voters. In 2005 he backed four initiatives designed to restrain some of the leverage public unions held under current law. Proposition 74 extended the probationary period for new teachers from 2 years to 5 and made it easier to dismiss teachers with unsatisfactory performance. Proposition 75 prohibited public employee unions from using union dues for political purposes without the consent of the union members. Proposition 76 limited the growth of state spending to the growth in revenues and gave the Governor certain veto powers. Proposition 77 changed the way California draws boundaries for congressional and legislative districts giving the power to a panel of retired judges approved by the voters. Opposed by the California State Teachers Union and aggressively financed, all four initiatives went down to defeat.[6]

Public employee unions hold a unique position in society. Unlike unions in the private sector where demands are constrained by the ability of a business to finance wage and benefits packages or go out of business, municipalities are monopolies. Public unions are well financed. Unlike private unions where dues collection is a cost, public union dues are deducted from pay and the cost of administration and collection is paid for by taxpayers. Because of the monopolistic nature of public services (if the local policeman doesn’t show up you can’t call a competing police station) unions hold a gun to the head of the public that pays them. With the potential for disruption in services from municipal transportation to schools, firefighting services to police protection, voters put enormous pressure on their elected representatives to settle public sector labor disputes.

But the root of the problem is the ability of public unions to influence the outcome of elections. As noted above the unions are highly organized and well financed. When legislation is proposed the union and union members are well versed on the effect, often involved in writing the legislation as in SB 400. Union leaders lobby on behalf of their constituency, and unions are well represented at the ballot box. Often, legislation is targeted and very specific in its desired effect and misses the scrutiny of the public. Set against this specialized and skilled lobbying machine is the typical voter. So far in 2009 there have been 1,589 bills introduced in the California Assembly and 833 bills introduced in the Senate.[7] The time and energy to simply understand and track a mere handful of legislation is daunting. The prospect of over 2,000 pieces of legislation each year leads to what is called “rational ignorance”, a condition that occurs when the cost of educating oneself on an issue exceeds the potential benefit that the knowledge would provide.[8] And with this power in place the unions are in a position to elect their bosses, the very individuals the public relies on to manage the finances of government and negotiate union contracts. It is pretty easy to see who wins and who loses in this proposition.

And unions now have the strong backing of the White House. When Governor Schwarzenegger attempted to reduce wages for unionized home care workers President Obama threatened to withhold billions of dollars in federal stimulus funds if the salaries weren’t reinstated[9] placing the federal government squarely in the middle of the fiscal problems of the State.

On January 30, 2009 the newly inaugurated president signed three executive orders,[10] 13494, 13495 and 13496 strengthening the union’s position in any projects funded under ARRA (the American Recovery and Reinvestment Act) and overriding state labor rules.[11] According to The Kansas City Star, “President Barack Obama …issued an executive order backing the use of union labor for large-scale federal construction projects.

“The order encourages federal agencies to have construction contractors and subcontractors enter project labor agreements. Those agreements require contractors to negotiate with union officials, recognize union wages and benefits and generally abide by collective-bargaining agreements…”[12]

And on the same day as those executive orders were signed a group of union leaders was welcomed to the White House. “I do not view the labor movement as part of the problem. To me, it’s part of the solution,” Mr. Obama told the group.[13]

On November 18, 2009 the California Legislative Analyst’s Office released its report on California’s fiscal outlook projecting a deficit $20.728 billion[14] for fiscal year 2010.


There is an unsettled debate over whether higher taxes and regulation are causing wealthy individuals and businesses to leave the state. What is not open for debate is that the cost of staying is rising while the quality of services provided by local and state government is declining. The poor are disproportionally impacted and that is the exact opposite of the goal of the so-called socially responsible. When a county employee recently told me about how tough it is to cut benefits for the poor, as the county has been doing repeatedly while grappling with their budget issues I suggested, “Why don’t the county employees take a pay or benefits cut and ease the burden for the poor?” The answer was immediate and unequivocal, “Are you kidding? We wouldn’t do that!” No doubt.

The best analysis I have seen of the power of public sector unionism was published by the Cato Institute on September 28, 2009.[15] It ends:

“As keepers of the public purse, legislators and local council members have an obligation to protect taxpayers’ interests. By granting monopoly power over their governments’ supply of labor to labor unions, elected officials undermine their duty to taxpayers, since this puts unions in a privileged position to extract political goods in the form of high pay and benefits that are way above anything comparable in the private sector. Under such an arrangement, government, being itself a monopoly, leaves the citizens whose money it squanders with no options.”
______________________________________________________________
[1] http://www.ci.vallejo.ca.us/GovSite/default.asp?serviceID1=712&Frame=L1
[2] http://www.sfgate.com/cgi-bin/article.cgi?f=/c/a/2008/05/06/BACH10HUK6.DTL
[3] http://www.bondbuyer.com/issues/117_87/-288275-1.html
[4] http://www.kget.com/news/local/story/3-at-50-retirement-debate/msXwaOs5k0eCtPms3hnh6g.cspx
[5] http://info.sen.ca.gov/pub/99-00/bill/sen/sb_0351-0400/sb_400_cfa_19990928_142123_sen_floor.html
[6] http://en.wikipedia.org/wiki/California_special_election,_2005#Results_2
[7] http://www.sen.ca.gov/~newsen/senate.htm
[8] http://en.wikipedia.org/wiki/Rational_ignorance
[9] http://www.kget.com/news/local/story/President-Obama-threatens-to-withold-billions/6bQ0EuJLlkq3mzJ0_q3dOA.cspx
[10] http://www.archives.gov/federal-register/executive-orders/2009-obama.html
[11] http://www.flemploymentlawblog.com/articles/government-contracts/
[12] http://artfularticulations.blogspot.com/2009/02/president-obama-executive-order-favors.html
[13] http://www.telegraph.co.uk/news/worldnews/northamerica/usa/barackobama/4401782/Barack-Obama-welcomes-union-leaders-to-the-White-House.html
[14] http://www.lao.ca.gov/handouts/education/2009/California%E2%80%99s_Fiscal_Outlook_Proposition_98_Briefing_111809.pdf
[15] http://www.cato.org/pub_display.php?pub_id=10569

Monday, November 2, 2009

Health Care Part II; Would you Buy an Insurance Policy from this Man?[1]

On October 29, Speaker of the House Nancy Pelosi released the long-awaited House version of health care reform which was crafted partly in Congressman Rangal’s Committee on Ways and Means. Actually, she introduced two bills; H.R. 3961, the Medicare Physician Payment Reform Act[2] and H.R. 3962, the Affordable Health Care for America Act.[3]

Let’s look at H. R. 3961. In my last blog post I discussed the $285 billion budgeted in 2010 for overturning the impending 21% cut in Medicare payments to physicians scheduled to take place on January 1, 2010. That discussion pointed to a budget resolution from the House Finance Committee passed on March 29, 2009[4] which requires enacting legislation. H.R. 3961[5] is that legislation and it seeks to permanently change the way physician reimbursements are calculated through amendments to Section 1848 of the Social Security Act,[6] the section of the Act that sets physician reimbursement rates.

In an effort to be diligent and to supply you, the reader, with a clear picture of how physicians are currently compensated under Medicare, I read Section 1848. It is 40 pages long, contains 14,000 words and 86 footnotes including legislative changes. The complexities of the language make it impossible to do a simple calculation and we can only assume the Mandarins in Washington have it right. But the question is really about the cost of this legislative change. In most of my analysis I consult the Congressional Budget Office report of the fiscal impact of legislation. Unfortunately H. R. 3961 has not been scored by the CBO. I assume this is because it is in the aforementioned budget resolution, which was. I score it as they did then at a cost of $285 billion. There is a silver lining. That is Ms. Pelosi’s claim that this legislation will fall under the new Pay-go rules codified by the house, but that silver lining dims significantly when you consider the Senate has openly rejected that kind of budgetary restraint.[7] Nevertheless this represents somewhere in the neighborhood of a quarter of a trillion dollars that have to come from somewhere.

The other examination is of H. R. 3962, the “Affordable Health Care for America Act.”[8] It is nearly 2,000 pages of legislative language. I again deferred in my analysis to the CBO.[9] Table 2 from their report shows their estimate of the Net Cost at $894 billion. The first thing I noticed is the disparity between the Net Cost and the impact on the budget. In years 2010 through 2012 the cost is minimal. Yet the impact to budget is different with deficit increases of $6.8 billion in


2010 and $16.6 billion in 2011. In 2012 there is a decrease of $15.8 billion. What accounts for this? As part of the American Recovery and Reinvestment Act of 2009 (ARRA) there was a temporary increase in payments to states for Medicaid (FMAP) which apparently is not considered part of health care when it is stimulus.[10] That stimulus expires on December 31, 2010 so the House has included a one-time extension of these payments into 2011 at an estimated cost of $23.5 billion. Payments to Primary Care Practitioners account for the majority of the rest at an average of $5.7 billion per year over the ten-year estimate.[11] This of course is in addition to the $285 billion discussed above from H.R. 3961. The majority of the savings comes from discounts in Part D (Prescription Drug Benefit) and Phase-in of Payment Based on Fee-for-service Costs.
But the best way to analyze the bill is to put it against the Chairman’s Mark of the proposed Senate legislation, which I discussed in my last blog post. Several things stick out. First, the House bill is 30% more costly than the Senate proposal. Interestingly both bills assume half of


the cost will be paid for by savings in Medicare, Medicaid and other programs. Second, the House bill forgoes tax on high premium plans and makes only minimal changes in existing tax expenditures, leaving us with a $598 billion shortfall compared to the Senate plan’s $85 billion. And how does this become deficit negative? The House plan charges significantly higher penalties for non participation (to the tune of $167 billion) and raises taxes on the wealthy by $536 billion! And, if the House is successful in enforcing Pay-go for H. R. 3961 they will either have to raise taxes by an additional $285 billion or cut spending by that amount. If the savings are truly realized the plan will simply be deficit neutral at a cost of $800 billion in potential new taxes.

Once again I will pose the question, “With an unfunded liability of $107 trillion in the current Social Security and Medicare program[12] can we afford to just spin our wheels?” It appears to me the “Affordable Health Care for America Act” will be very unaffordable for someone, possibly everyone.


___________________________________________________

[1] http://www.politico.com/news/stories/0609/24167.html
[2] http://www.ssa.gov/OP_Home/ssact/title18/1848.htm
[3] http://docs.house.gov/rules/health/111_ahcaa.pdf
[4] http://budget.house.gov/PRArticle.aspx?NewsID=1677
[5] http://docs.house.gov/rules/health/111_sgr1.pdf
[6] http://www.ssa.gov/OP_Home/ssact/title18/1848.htm
[7] http://thehill.com/homenews/house/63399-senate-move-on-medicare-payments-sets-up-pay-go-showdown-with-house
[8] http://docs.house.gov/rules/health/111_ahcaa.pdf
[9] http://www.cbo.gov/ftpdocs/106xx/doc10688/hr3962Rangel.pdf
[10] http://www.legis.state.ia.us/lsadocs/SC_MaterialsDist/2009/SDDLH031.PDF
[11] http://www.cbo.gov/ftpdocs/106xx/doc10688/hr3962Rangel.pdf, pg. 23, Table 3.
[12] http://www.freerepublic.com/focus/news/2269595/posts

Sunday, October 18, 2009

“You Lie!” The American Health Care Debate


In my lifetime no domestic issue has raised more rancor in America than the debate raging over health care. Representative Joe Wilson’s outburst has been repeated over and over by both sides, from the capitol to my own dinner table, as we wrestle with what may be the seminal issue of the Obama presidency’s first year. So, is government-funded health care just one more Unfunded Liability? Let’s take a look.

Support for the Senate version of health care reform got a boost this month when the CBO, in a letter from Director Douglas Elmendorf to Senator Max Baucus, said, “…enacting the Chairman’s mark, as amended, would result in a net reduction in federal budget deficits of $81 billion over the 2010-2019 period.” [1]

The “Chairman’s mark” of the America’s Healthy Future Act is a marked up version of the proposed legislation that came out of the Senate Committee on Finance.[2] It is not the legislation. As Director Elmendorf’s letter states, “…analysis is preliminary in large part because the Chairman’s mark, as amended, has not yet been embodied in legislative language.”

Payment for reform comes from two sources: new revenue and cost savings in existing government funded programs. So as I thought about how to approach an analysis it occurred to me there are two steps: The first is to look at the line items to see who pays and the second is to ask the question of how likely these items, if passed, will survive and generate the revenue or savings envisioned. At the very least the analysis provides a baseline from which to track the legislation to see what passes and what doesn’t and to monitor its performance over time.

The cost for the proposal is broken down into the following three categories: Medicaid and Children’s Health Insurance Program (CHIP), insurance exchange subsidies, and tax credits for small employers. The total estimated cost is $829 billion. Cost offsets (revenue) in the form of additional taxes amount to $311 billion and are divided into these four categories: a tax on high premium insurance plans, penalty payments by uninsured individuals, penalty payments by non-offering employers, and tax revenue from the expansion of insurance. Two thirds of the revenue (or $201 billion) is tax on premium plans. How likely are those plans, once the rules are set, to be modified to avoid some or all of the tax? Beware the law of unintended consequences. Nevertheless the net result still leaves a half trillion dollar hole.


Now we look at the intangibles

Of the total $420 billion in savings $404 billion comes from reductions in direct spending, or in other words, savings on existing government outlays. There are 19 categories and multiple sub categories. I will focus on the largest.

Excluding the Medicare Improvement Fund, which I will address later, I see these five major categories: (1) savings from reduction in direct benefits under current programs; (2) reductions in payments to health care providers; (3) savings in payments to drug companies; (4) reductions in payments to health care facilities primarily hospitals; (5) and modification of current plans.

Figures in Billions of Dollars
1. Reduced benefits..........................................................$ 18.8
2. Reduced payments to health care providers.....................$ 73.7
3. Reduced payments to drug companies............................$ 28.6
4. Reduced payments to health care facilities.......................$168.4
5. Modification of Medicare Advantage (Part C)..................$117.4

Benefit reductions are accomplished by means testing and raising co-payments on higher earning individuals. Savings pertaining to payments to health care providers are made by reducing and/or capping the growth of payments to doctors and other providers. Reductions in payments to drug companies are accomplished by switching to generics. Reduced payments to facilities come from a significant shift from emergency room use to other facilities, presumably primary care providers. The last savings is a modification of a current program called Medicare Advantage that has resulted in significantly higher delivery costs than Medicare A and B. Medicare Advantage lets a beneficiary shift the administration of Medicare to other plan providers such as Health Maintenance Organizations (HMO), Preferred Provider Organizations (PPO), Private Fee-for-Service Plans (PFFS), Special Needs Plans (SNP) and Medical Savings Account Plans (MSA).

While there is little doubt the expense side of the ledger will survive, one must question the revenue side. As pointed out earlier none of the proposals are in legislative language. We can only imagine the depth of lobbying going on. We can also imagine a world where the legislation actually passes as envisioned. What are the consequences? For example if we drain $168.4 billion of revenue from the hospitals in this country, how many will survive? With shorter patents on drugs and reduced cash flow to drug companies how much capital will flow into innovation? And how likely is sapping doctors, nurses, hospice care providers and homecare providers of $73.7 billion in income to promote better care and service if in fact it happens? As we shall see shortly, for the doctors it won’t.

But the real question in my mind is this: can the government execute? For example, in the past, cuts scheduled in fee-for-service to physicians have been routinely overridden by congress. From the 2009 annual report for the trust funds of Medicare parts A and B, “Congressional overrides of scheduled physician fee reductions…could jeopardize Part B (payments for doctor visits) solvency… Part B costs have been increasing rapidly, having averaged 7.8 percent annual growth over the last 5 years, and are likely to continue doing so. Under current law, an average annual growth rate of 5.5 percent is projected for the next 5 years. This rate is unrealistically constrained due to multiple years of physician fee reductions that would occur under current law, including a scheduled reduction of 21.5 percent for 2010. If Congress continues to override these reductions, as they have for 2003 through 2009, the Part B growth rate would instead average roughly 8.5 to 9.0 percent.”[3] To watch Secretary Giethner’s press conference releasing the report click here.

So what did Congress do? The answer is sleight of hand. $22.2 billion, 5% of the “savings” in the current legislation, are from funds scheduled to be spent between 2014 and 2019 from the Medicare Improvement Fund.[4] They were actually moved to a budget resolution for Fiscal Year 2010 and increased to a whopping $285 billion overriding past and future reductions in one fell swoop. So the way the current bill became “deficit neutral” was to actually authorize a quarter of a trillion dollars of Medicare spending that will occur during the years the bill covers but keep it out of the bill.[5] Where is Joe Wilson when we need him?

The last item I will address is the Medicare Commission. From Director Elmendorf’s letter to Senator Baucus, “The projected longer-term savings for the proposal also assume that the Medicare Commission is relatively effective in reducing costs—beyond the reductions that would be achieved by other aspects of the proposal—to meet the targets specified in the legislation. The long-term budgetary impact could be quite different if those provisions were ultimately changed or not fully implemented. (If those changes arose from future legislation, CBO would estimate their costs when that legislation was being considered by the Congress.)” The Medicare Improvement Fund[6] was created by Congress in 1999 with complete implementation by 2003 with three objectives:

• the design of a premium support system,
• improvements to the current Medicare program, and
• financing and solvency of the Medicare program

So can the government execute? Can we trust Congress to pass the legislation they are proposing without bowing to pressure from lobbies? Even if passed will Congress avoid tinkering either with the level of benefits or the adjustments in compensation? All evidence suggests the answer is no. Each year we continue to add one unfunded liability to another. The most dangerous four words in the English language be it investing or government spending are, “This time is different.” Albert Einstein defined insanity as, “Doing the same thing over and over again expecting different results.”

But the most frightening result of this is that if it succeeds at all levels it is only deficit-neutral. With an unfunded liability of $107 trillion in the current Social Security and Medicare[7] can we afford to just spin our wheels?
________________________________________________
[1]http://www.cbo.gov/ftpdocs/106xx/doc10642/10-7-Baucus_letter.pdf
[2]http://thehealthcarevalueblog.com/files/2009/09/Health-Care-Reform-Mark-Document-FINAL.pdf
[3]http://www.cms.hhs.gov/ReportsTrustFunds/downloads/tr2009.pdf
[4]http://www.ssa.gov/OP_Home/ssact/title18/1898.htm
[5]http://www.healthreformmusings.com/2009/03/articles/cost-of-health-care/medicare-physician-fix-may-result-in-more-fundamental-reform/
[6]http://www.ssa.gov/OP_Home/ssact/title18/1898.htm
[7]http://www.freerepublic.com/focus/news/2269595/posts

Sunday, October 11, 2009

Subsidized Housing; America's Iceberg


Friday’s issue of the New York Times has an article about the pending problems with the Federal Housing Administration (FHA).(1) For those of you who read this blog that is old news. But it is just the tip of the housing iceberg. The real danger lies within the Government Sponsored Enterprises (GSEs).

The Federal National Mortgage Association was part of the FHA until 1968 when, under mounting budget pressures brought on by his policy of “guns and butter,” President Lyndon Johnson privatized Fannie Mae taking it off the federal government’s balance sheet. Unfortunately he didn’t disconnect it from the government’s guarantee. Two years later the Federal Home Loan Mortgage Corporation, later known as Freddie Mac, was formed to “compete” with Fannie Mae. Both became public companies and were two of the largest companies in the Fortune 500.

Initially both GSEs operated like great big savings and loans borrowing from the public and purchasing mortgages for their portfolios. In addition to the implied government guarantee the GSEs were exempt from state and federal income tax and, unlike any other companies in the Fortune 500, were not required to report potential financial difficulties in their annual filings. In the early 1980s Fannie Mae faced bankruptcy because of a mismatch between assets and liabilities and a surge in foreclosures. Losing $1 million a day, by 1983 its net worth had fallen below zero. But the government came to the rescue and under an accounting change sponsored by then President Regan, both Fannie and Freddie were able to capitalize the losses on their portfolio loans, some worth only seventy cents on the dollar, sell the loans as mortgage backed securities and amortize the loss over the next 20 to 30 years. This policy, called “forbearance” allowed the lenders to operate with negative net worth. Fannie president David Maxwell increased lending standards and moved the portfolio into adjustable loans to reduce the sensitivity to short term borrowing costs.(2) The sensitivity between assets and liabilities improved as both GSEs extended the maturities by issuing longer term debt and securitizing and selling many of their loans. As the yield curve steepened Fannie recovered but the same fate that befell Fannie Mae hit the savings and loan industry leading to the failure of over 740 institutions at a cost to the taxpayer of $124 billion.(3)

Not content to let the mere subsidization of housing rest with the benefits already bestowed on Fannie and Freddie successive congresses and administrations pressed their own agendas on the agencies. The profits of Fannie and Freddie were ripe for use as subsidies to the under-served segment of the market, the euphemism for low to moderate income home buyers. The Federal Home Loan Mortgage Corporation Act updated Freddie’s charter in 2005, “to provide ongoing assistance to the secondary market for residential mortgages (including activities relating to mortgages on housing for low- and moderate-income families involving a reasonable economic return that may be less than the return earned on other activities)…”(4) Much of this subsidy was provided to bring in the very borrowers who today cannot afford the homes they were encouraged to buy.

And then came the Great Panic of 2008. With the future financing of the GSEs very much in doubt the Bush administration released a proposal that would temporarily authorize the Department of the Treasury to purchase $100 billion each, up from $2.25 billion, of Fannie Mae and Freddie Mac obligations. At the time the CBO estimated the chance of this occurring at less than 50% and “that the expected value of the federal budgetary cost from enacting this proposal would be $25 billion over fiscal years 2009 and 2010.” The CBO assigned only a 5% probability the price tag would reach $100 billion between them. On September 7, 2008 Fannie Mae and Freddie Mac became wards of the U. S Government. At the end of March, 2008 the combined portfolio of mortgage loans and guarantees of the GSEs stood at $5.2 trillion(5) and by July 2009 the bailout was fast approaching that $100 billion mark. Mortgage analyst Bose George of Keefe, Bruyette & Woods said, “We’re assuming they each will cross the $100 billion mark fairly soon.”(6)

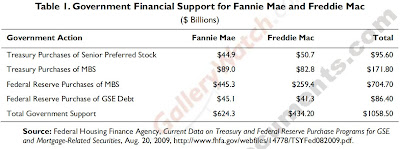
Today the picture is only bleaker. Losses continue to mount. Renegotiated loans are re-defaulting at a rate in excess of 50%(7) and the default rate on the current portfolio is approaching 10%. On September 9, 2009 the Congressional Research Service released a report entitled “Options to Restructure Fannie Mae and Freddie Mac”.(8) The table below from that report shows that total taxpayer support for Fannie and Freddie now stands at $1.058 trillion dollars.


In a recent interview Rep. Barney Frank (D-Mass.) responding to a question of becoming Secretary of Housing and Urban Development said, “I want at least two years with President Obama and a solidly Democratic Senate so that we can get the federal government back in the housing business.” With the government insuring 90% of current home loan activity I am having a real tough time finding what’s left for the government to "get...back in..."

And see the debt ticker to the right of this blog? Add the $5.2 trillion of debt guaranteed by the GSEs that isn’t yet shown on the government’s balance sheet. Including the GSEs government debt now stands at a mind-boggling 122% of GDP. There are only three countries in the world with a higher percentage; Lebanon, Japan and Zimbabwe.(9) I wonder which one we are aspiring to?
____________________________________

(1) http://www.nytimes.com/2009/10/09/business/09fha.html?_r=1&th&emc=th
(2) “Getting Fannie Mae in Shape” NY Times, December 26, 1985
(3) http://en.wikipedia.org/wiki/Savings_and_loan_crisis
(4) Federal Home Loan Mortgage Corporation Act, 12 U.S.C. Sec. 1451 Note. Sec. 301(b)3.
(5) CBO Report to the Committee on the Budget, U. S. House of Representatives by Peter R. Orszag, CBO Director, July 22, 2008
(6) http://money.cnn.com/2009/07/22/news/companies/fannie_freddie_bailout/
(7) http://finance.yahoo.com/news/Homeowners-in-financial-apf-1726904164.html?x=0&sec=topStories&pos=6&asset=&ccode
(8) Options to Restructure Fannie Mae and Freddie Mac, N. Eric Weiss, September 9, 2009
(9) https://www.cia.gov/library/publications/the-world-factbook/rankorder/2186rank.html

Monday, October 5, 2009

The FDIC: Fuzzy Math?


Like clockwork each Friday since January 16, save three, the FDIC has released a list of banks it has closed. This Friday there were three.(1) The mounting closures now total 98 and are taking a toll on another government run insurance company, the Federal Deposit Insurance Corporation. The fund within the FDIC that insures deposits is called the Deposit Insurance Fund (DIF). For 2008 the DIF’s loss totaled $35.1 billion compared to income of $2.2 billion for the previous year. As a result, the DIF balance declined from $52.4 billion to $17.3 billion as of December 31, 2008.(2)

2009 has not been kinder. Despite the strength in financial stocks since the end of March, the FDIC issued another grim quarterly report Thursday on the health of the nation’s banks. In the second quarter of 2009 the banking industry lost $3.7 billion amid a surge in bad loans made to home builders, commercial real estate developers and small and midsize businesses. Meanwhile the FDIC’s deposit insurance fund dropped to $10.4 billion, its lowest level in nearly 16 years. And the number of “problem banks” increased to 416, from 305 in the first quarter, and is expected to remain high.(3)


Without action to replenish it, the DIF will have a negative balance as of September 30, while its longer-term liquidity will dry up in the first quarter of 2010.(4) On September 30 Federal regulators said the likely cost of failed banks to the FDIC over the next 4 years will be $100 billion up from $70 billion forecast in March, an increase of almost 50%.(5)

The FDIC was created in 1933 in response to the thousands of bank failures that occurred in the 1920s and early 1930s. Like the FHA it has never cost the taxpayer anything since its founding and has only had a negative balance one year. Now it too is staring into the abyss.

So what’s the plan? Sheila Bair wants to accelerate the annual fees collected from insured institutions taking the next three years of fees into current income. Let’s forget that this is in fact an accounting trick that depletes bank cash but doesn’t deplete their book capital. It amounts to only $45 billion. So to plug a $100 billion gap the FDIC is going to forgo all its fee income for the next three years. And by the way since when does 0+45=100? One might also ask why the assessment revenue, which in 2008 was $4.42 billion will average $15 billion over the next three years? Part of that might be from the larger account balances insured, up to $250,000 from $100,000, and part will be from an increase in the insurance premium of .03%. But that doesn’t add up either. Non assessment revenue from 2007 to 2008 was roughly flat at $2.5 billion so once again where does all the revenue growth come from? And this is all predicated on a loss estimate that has increased almost 50% in the last 6 months.

Will the FDIC be dipping into its credit line from the US Treasury (aka taxpayer) for the first time in its 75 year history? Today that credit line stands at a staggering $500 billion.
__________________________
Comic courtesy of Oak Norton
(1) http://www.fdic.gov/bank/individual/failed/banklist.html
(2) http://www.fdic.gov/about/strategic/report/2008highlight/index.html
(3) http://www2.fdic.gov/qbp/2009jun/qbp.pdf
(4) http://industry.bnet.com/financial-services/10003682/fdic-wants-banks-to-pay- in-advance-to-restore-deposit-insurance-fund/
(5) http://www.npr.org/templates/story/story.php?storyId=113333298&ft=1&f=1017

Thursday, October 1, 2009

The FHA and Subprime America: House on Fire!


The Federal Housing Administration, the longtime self-funded mortgage arm of government insurance programs, is now taking a number and waiting in turn for its taxpayer-financed government bailout. Get out your checkbooks.

Created in 1934 the FHA’s purpose was to stimulate mortgage underwriting by insuring mortgages for risk-averse banks and encouraging a new wave of home-loans. The program worked during the depression and continued to work even as an increasingly privatized mortgage industry developed ever-more creative loan packaging to insure sub-prime mortgages. Promoted by politicians the FHA evolved in the 21st century to underwrite home loans for low and moderate-income buyers whose shaky credit would otherwise lock them out of the housing market. Whether or not you agree that every low-income American with Swiss-cheese credit deserves to own his or her own home is beside the point. As a taxpayer, and therefore a stakeholder in the FHA, you could rest easy knowing that “the FHA is the only government agency that operates entirely from its self-generated income and costs the taxpayers nothing.”(1) But that was in 2006, when the FHA insured just 2.7% of the single-family mortgage market. By the second quarter of 2009 its market share was 23% and self-funding was as viable as General Motors’ Hummer.

Led by the government’s attempt to stem the housing collapse this 10-fold increase in market share was due in large part to the Housing and Economic Recovery Act of 2008 which then-President Bush signed into law on July 29, 2008. Sponsored by Reps. Barney Frank (D-Massachusetts) and Maxine Waters (D-California) the bill included new authority for FHA to insure up to $300 billion of troubled mortgages. FHA is working overtime to accomplish the task.

FHA loans are packaged by mortgage bankers and sold in pools of Ginnie Maes then distributed by Wall Street dealers to investors either as Mortgage Backed Securities (MBS’s) or as Collateralized Debt Obligations (CDO’s). Ginnie Maes carry the full faith and credit guarantee of the U. S. Treasury. Their losses are covered by the FHA. So Ginnie Mae, a full faith and credit issuer of the government is on track for a record issuance of securities and the taxpayer’s backstop is the FHA. On September 10, 2009, Ginnie Mae announced it had issued $45 billion of mortgage backed securities in August alone, the fifth consecutive month of record issuance.(2)

Swamped with increasing delinquencies the FHA is “probably going to need a bailout at some point because they’re making loans in a riskier environment,” says Edward Pinto, a mortgage-industry consultant and former chief credit officer at Fannie Mae. “…I’ve never seen an entity successfully outrun a situation like this.” The problem stems from the FHA’s cash flows. As an insurance company, the FHA earns a percentage of loan payments on its insured mortgages. When its market share was in the single digits and home-owners were actually paying their bills, things worked well. But FHA delinquencies have increased from 5.4% a year ago to 7.8% today and accelerating default rates are rapidly eating through the FHA’s reserves. David Stevens, the FHA Commissioner, told Congress that the agency will fall below the 2% minimum reserve required in its charter, down from a 6.7% reserve in 2007.(3) In 2007 FHA earned $1.521 billion and gross costs (government speak for expenses) were $3.89 billion for a net cost of $2.369 billion, the first loss in 75 years of operation. In 2008 revenue was down slightly at $1.471 billion and costs soared nearly tripled to $11.378 billion for a net cost of $9.9 billion! (4)

And how is the program created in 2008 to help troubled borrowers working? On Wednesday the Office of the Controller of the Currency and the Office of Thrift Supervision reported re-default rates on troubled borrowers is running in excess of 50%.

With 5 months of record issuance behind us, and ostensibly many more to come, why isn’t the FHA on track for record profits? The FHA funds itself by receiving an ongoing percentage of the interest payment made by the borrower for insuring each mortgage. But now delinquencies are increasing faster than even the government can issue debt. Revenue on the portfolio is 37.5 basis points or approximately 1/3 of 1 percent. At the end of Fiscal Year 2008 the outstanding portfolio was $534 billion generating roughly $2 billion in revenue and defaulting at a rate of almost 8%. At September 30, 2008 the FHA surplus reserve fund was $12.9 billion. That number is expected to fall below $10 billion by September 30, 2009, the end of this fiscal year, for a net decline of $4.7 billion dollars. This gives the FHA a leverage ratio of 54:1 nearing twice the highest leverage of the major banks prior to the 2008 crash on a portfolio with only 3.5% down payment. Do the math.

And this is a drop in the bucket compared to our next discussion: Fannie Mae and Freddie Mac. With the combined entities of FHA, Fannie Mae and Freddie Mac, the American taxpayer is now guaranteeing 90% of all the home mortgages made in America. And then the Federal Reserve is purchasing those loans so we are first guaranteeing the loans then buying them! Huh?

1. http://www.nls.gov/offices/hsg/fhahistory.cfm
2. http://www.ginniemae.gov/news2009/news2009.asp?Section=Media
3. http://www.washingtonpost.com/wp-dyn/content/article/2009/09/18/AR2009091803578.html?hpid=topnews
4. 2008 Department of Housing and Urban Development Annual Performance and Accountability Report (Available on request)

Monday, September 21, 2009

The Pension Benefits Guarantee Corporation


The US Government runs a number of insurance plans. As we debate the issue of adding another, the so called “government option” for health care reform, it is instructive to look at the existing programs. These include FHA, Ginnie Mae, Fannie Mae, Freddie Mac and a number of student loan programs (which incidentally may disappear under legislation that has passed the House and is on its way to the Senate which eliminates all federal aid to students who don’t qualify under a needs based system). Today we will look at the Pension Benefits Guarantee Corporation.

PBGC is a federal agency created by the Employee Retirement Income Security Act of 1974 (ERISA) to protect pension benefits in private-sector traditional pension plans known as defined benefit plans. If a participating plan terminates, usually through the sponsor’s bankruptcy, without sufficient money to pay all benefits PBGC's insurance program will pay the benefits provided by that plan up to the limits set by law. PBGC financing comes from insurance premiums paid by participating companies which are invested, from the assets taken from defunct pension plans, and from recoveries from the companies formerly responsible for the plans. The PBGC was presumably never supposed to be funded by the American public.

In hearings in 2005 Jim Nussle, Chairman of the House Budget Committee said, “Now in theory, the PBGC was supposed to be completely self-financing…But as we are discovering, and as most of us here know, that is not what is happening.” That year there was a $23 billion shortfall. Later in the hearing Chairman Nussle said, “To make matters worse, the Center on Federal Financial Institutions, which tracks pensions, tells us that on the current path, all PBGC assets will be exhausted, completely gone, by 2021, just 15 years from now.” We appear to be ahead of schedule. As it turns out, the PBGC has continuously operated in deficit every year since 2002. Through the second quarter of 2009 the unaudited deficit is $33.5 billion.(2) PBGC estimates that in just the auto sector alone underfunding of defined benefit plans is $77 billion. At the end of fiscal year 2008 audited financial statements showed total assets of $61,648,000,000. If we combine the $33.5 billion loss and just the unfunded auto liabilities the liabilities total over $95 billion. So the PBGC, a self funding government provided and managed insurance plan has a net deficit of over $30 billion, in other words it is bankrupt. Again from Chairman Nussle’s opening remarks in 2005, “So where does that leave us? Well, under the current scenario, if and when PBGC’s assets fall short, the choice is really one of two right now. Either for pension holders to lose the promised retirement benefits or for the taxpayers to get slapped with the bill for failed private pension plans.” So once again American taxpayers, many of whom have limited entitlements and no defined benefits, will be asked to pay the bill. The PBGC was in theory going to pay for itself, just as in theory the public option for health care will “pay for itself in future savings.”

And by the way, the PBGC was recently given wider investment authority and made its first investments in the stock market in the second quarter of last year setting up a Federal Government agency making investments in private sector companies. As a result of those investments PBGC experienced a 23% loss in its assets for the fiscal year ending September 30, 2008.(3) It is also interesting to note that the former head of PBGC, Charles Millard, is currently under investigation for improprieties for directing funds for favors involving, among others, Goldman Sachs.(4) This happened as a result of the fund’s recently granted ability to invest in publicly traded equities.

So here we have another unfunded liability, created by an entitlement in the form of a guaranteed benefits plan, under-insured by a government-run insurance program placing the responsibility for payment squarely on the shoulders of the American taxpayer.

Next issue: the housing insurance programs, all bankrupt or tottering on the edge, which the government has started since FDR created the Federal Housing Administration during the Depression.

1. http://ftp.resource.org/gpo.gov/hearings/109h/21761.pdf
2. http://www.pbgc.gov/media/news-archive/news-releases/2009/pr09-30.html
3. http://www.boston.com/news/nation/washington/articles/2009/03/30/pension_insurer_shifted_to_stocks/?p http://ftp.resource.org/gpo.gov/hearings/109h/21761.pdf
4. http://documents.nytimes.com/documents-in-the-pbgc-investigation#p=1

Monday, September 14, 2009

General Motors


For many years I have watched compliant politicians bow to the unions, often in collusion with business, and the result is a bigger and bigger pile of unfunded liabilities. The most notorious side-effect of that deference is the failure of General Motors.

Like many of the current Federal benefit programs the United Auto Workers used a young workforce to fund ever increasing benefits. But as the work force aged and more and more retirees began to draw on the promised benefits, General Motors found itself in trouble. Its pension fund failed to earn enough to balance what the company was paying out in benefits while the ratio of workers paying in to retirees taking out got smaller. Whether it was poor money management, over-exuberant forecasting of returns, or endless faith in the generosity of a government hungry for union votes, GM repeatedly came off the tracks, only to be reset by bailouts.

A recent history of quick-fix GM bailouts begins in 2001. Just as consumers peeked out their heads from the detritus of the imploded dot.com bubble the far more terrible collapse of the world trade center froze consumer spending. With car sales stalled completely General Motors found itself in dire straits. Unfunded pension fund liabilities threatened to topple the automotive giant. But as usual the government stepped up with tax incentives on big cars and trucks while GM unveiled its patriot-themed campaign to “keep America rolling” with 0% financing for 5 years on all new vehicle purchases. Hummer sales soared but the underlying problems at GM continued, ignored for the time being as the new SUVs’ revving engines drowned out any cries for real financial repairs.

One of those necessary repairs was a revamping of unrealistic assumptions on the rate of return earned in the pension fund itself. A New York Times article published August 25, 2002 said in part, (1)

“Lately, the focus is on GM’s pension fund, which totaled $80 billion two years ago but has dropped to $67 billion. Although the company's current pension payouts are not exceeding pension fund earnings, the market's volatility has destroyed GM’s assumption that it would earn a net return of 10 percent a year on the fund assets. Mr. Devine said GM was ready to transfer cash to fund some of the future liability at year-end, but he contends that cannot be done all at once without endangering GM’s product spending. Yet until the shortfall for future liability is funded, he acknowledged, the issue will not go away.

“'It doesn't get off the table until it gets off the table,' he said.”

At the end of 2002 GM’s unfunded pension obligations stood at $19.3 billion. In an attempt to fix the shortfall GM issued $13.2 billion of a new type of bond complete with Government subsidy (2). The proceeds were contributed to the fund along with a $4.26 billion “tax shield” created by that bond issuance. In theory GM should have been close to fully funded. Yet when it collapsed (again, and this time for real) in 2009, the unfunded pension liabilities were $13.5 billion. So from the time the quick-fix financing scheme was cooked up in 2002 to the final GM collapse in 2009, the unfunded liability in the pension fund grew by 50%. And GM became, as one commentator put it, “a benefits company funded by an auto company.”

The taxpayer is now invested in GM to the tune of $80 billion and growing. And the history of government bailouts to GM continues: we just added $3 billion more in taxpayer money to bribe individuals to buy cars through the “cash for clunkers” program!

But who is now responsible for the UAW pension fund? Normally the Pension Benefit Guaranty Corporation, an insurance company run by the U. S. Government similar to the FDIC, would step in and assume those liabilities. So the theory is by bankrupting GM and letting the emergent company continue to operate the pension fund the PBGC would avoid taking that loss. What happens if the new GM fails? It turns out that the PBGC and the American Taxpayer are on the hook, once again, for the benefits of the UAW. But the PBGC itself is just one more, all together now, “unfunded liability” of the US Treasury. The PBGC was formed to insure the pension funds of participating corporations. In concept it was supposed to be self-funding. In reality it has been in deficit every year since 2002. As Mr. Devine said earlier, “It doesn’t get off the table until it gets off the table.”

My next article will start to look at all the various insurance companies run by the Federal Government beginning with the Pension Benefits Guarantee Corporation.

(1) http://www.nytimes.com/2002/08/25/business/business-in-detroit-steady-hands-are-steadying-nerves.html?pagewanted=all
(2) http://www.nytimes.com/2003/06/21/business/gm-to-raise-10-billion-for-pension-gap.html
Photo from: http://www.durangoherald.com/sections/News/2008/11/12/Student_gets_SUV_stuck

Thursday, September 10, 2009

Beware the Public Option


I originally anticipated discussing the collapse of GM in this blog, however given the debate currently raging over health care reform this is where I will focus today because, guess what, the hidden cost of health care overhaul is… another Unfunded Liability!

Last night the President laid out a plan for health care overhaul. The plan contains numerous necessary reforms, others are not. Here I will only take issue with one: the Public Option. Why? Because the Public Option is a prime example of an unfunded liability.

Here is what he said, “But an additional step we can take to keep insurance companies honest is by making a not-for-profit public option available in the insurance exchange.” And how does that get paid for? “... not a dollar of the Medicare trust fund will be used to pay for this plan… Reducing the waste and inefficiency in Medicare and Medicaid will pay for most of this plan.” Isn’t this contradictory? In other words, if Medicare and Medicaid savings are going to pay for this isn’t the payment by definition going to come out of money that would otherwise be available to the Trust Fund?

This provides us with an easy segue into a discussion of the financial health of Medicare. If we are relying on savings in one entitlement to pay for another the former had better be financially sound. It is not.

Each year the Social Security and Medicare Boards of Trustees publish an annual report along with “A Message to the Public”.(1) In this year’s report signed by the Secretary of the Treasury as Managing Trustee it states, “As was true in 2008, Medicare's Hospital Insurance (HI) Trust Fund is expected to pay out more in hospital benefits and other expenditures this year than it receives in taxes and other dedicated revenues. The difference will be made up by redeeming trust fund assets. Growing annual deficits are projected to exhaust HI reserves in 2017, after which the percentage of scheduled benefits payable from tax income would decline from 81 percent in 2017 to about 50 percent in 2035 and 30 percent in 2080. In addition, the Medicare Supplementary Medical Insurance (SMI) Trust Fund that pays for physician services and the prescription drug benefit will continue to require general revenue financing and charges on beneficiaries that grow substantially faster than the economy and beneficiary incomes over time.”

The consequence of this statement is profound. The current Medicare system will need substantial savings and additional revenue just to keep its own head above water. The problem once again is the unfunded liability that arises from guarantees of benefits without a dedicated payment plan. Simply reducing the deficit of an unfunded liability doesn’t create funding available for another. Today the unfunded liability in Medicare alone is $85.9 trillion or six times the total annual production of our economy. The report goes on, “The projected exhaustion of the HI Trust Fund within the next eight years is an urgent concern. Congressional action will be necessary to ensure uninterrupted provision of HI services to beneficiaries. Correcting the financial imbalance for the HI Trust Fund—even in the short range alone—will require substantial changes to program income and/or expenditures.” And this is how we are going to fund the new Public Option?
___________________________________________________________________________
(1) http://www.ssa.gov/OACT/TRSUM/index.html

Tuesday, September 8, 2009

Unfunded Liabilities 101

Unfunded liabilities are insidious critters. Say for example you buy a ten year old house. When you buy it the roof is fine. But it has a fifteen year roof which, after five years, starts leaking. Time for the roofer but you didn’t include the cost of a new roof in your budget. Congratulations, you’ve just experienced your first unfunded liability. Now you must take away from other spending, draw on savings or get a loan.


Let's play a game. Make a list of all your future liabilities: a college education, retirement or simply the replacement of your car? How many of these have a funding plan? Those that don't are unfunded liabilities. Now think about the government. If you are a taxpayer, every future commitment the government makes becomes your obligation...


Next week the low hanging fruit, the auto industry.